Mission
To strengthen the educator workforce through professional standards, policy, and innovation.
Vision
An equity-minded educator workforce that facilitates learning and growth for each and every student.
Values
- Educator voice
- Diversity, equity, and inclusion
- Educator excellence for student success
- Community engagement
- Learning and innovation
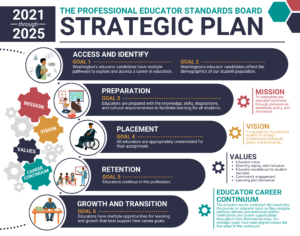
Strategic plan: 2021-2025
- Download the strategic plan (PDF)
View our strategic plan one pager. - Annual progress and policy snapshot (2021)
We are one agency with two boards. We work to ensure Washington’s educator workforce is composed of equity-minded, professional educators who meet the diverse needs of students, schools, and districts. We work towards this vision by creating innovative policies that strengthen educator quality, support workforce development, and advance equitable pathways into the profession. The Professional Educator Standards Board and the Paraeducator Board recognize that high standards for all educators are essential to student success and achievement.
Strategic priorities
- Center the perspectives and experiences of practicing educators.
- Advance equity in the preparation and practices of educators.
- Foster and strengthen shared decision-making through inclusive partnerships.
- Use data and research to make informed decisions.
- Prioritize initiatives that advance racial justice in education.
- Engage and educate the public about policy efforts to innovate, improve, and respond to Washington’s education system.
Goals and the educator career continuum
The educator career continuum demonstrates the journey an educator takes as they navigate pathway options, preparation programs, certification, and growth opportunities throughout their professional roles. Our strategic goals have been aligned across the five areas of the continuum to identify and address gaps, challenges, and opportunities in and outside of our policy work.
Click on an area of the career continuum below to explore the aligned goals and objectives.
Access and identify: Educator candidates are exploring pathways to a career in education.
The journey to a meaningful career in education begins with a roadmap of clearly defined pathways to get there. By cultivating interest among students and providing them with opportunities to explore a teaching career, these pathways can start as early as high school. Other pathways are needed for those looking to explore traditional teacher preparation options, either through degree or certificate programs. Many individuals, such as district employees or technical professionals, want to bring “real life” experience to the classroom through a career change, often involving alternative pathways into the profession.
Goal 1: Washington’s educator candidates have multiple pathways to explore and access a career in education.
Objectives
- Remove institutional barriers for candidates wanting to participate in the educator workforce.
- Increase equitable pathways into the profession, such as “grow your own” educator programs.
- Support incentives for candidates pursuing a pathway towards certification in an educator shortage area.
Key performance indicator
- PESB is working to compile a map of regional access to preparation programs and grants.
Goal 2: Washington’s educator candidates reflect the demographics of our student population.
Objectives
- Increase outreach efforts to promote educator pathway opportunities
- Facilitate collaborative community partnerships to support programs that are responsive to regional workforce needs
- Expand access to support services and resources for underrepresented individuals pursuing a career in education
Key performance indicators
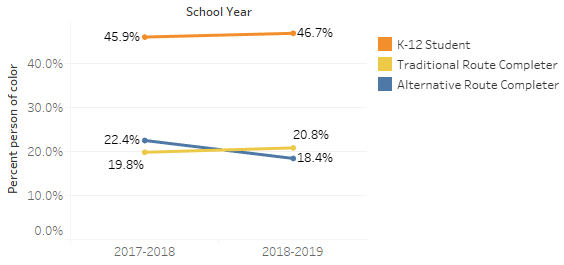
Race ethnicity
K-12 students are more diverse than the educator workforce and completers of teacher preparation programs. The biggest representation gap between teacher preparation program completers and K-12 student composition is Hispanic / Latino of any race. In 2018-2019, this gap was 16.8% (23.6% of K-12 students were Hispanic / Latino and 6.8% of alternative route completers were Hispanic / Latino). To close this gap, teacher preparation program completers will need to be at least as diverse as the K-12 student population, if not more.
View this data in more detail.
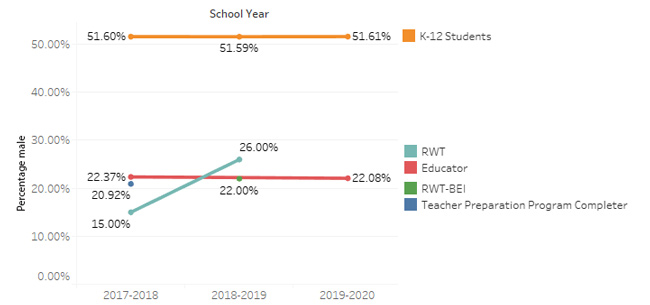
Gender
The majority of teacher preparation program completers and the educator workforce are women. In 2018-2019, 22.08% of the educator workforce was male. To close this representation gap, teacher preparation program completers will need to be more proportionally male and gender X (non-binary and other gender choices). Data collection around non-binary and other genders is still very new and is likely not representative.
Preparation: Preparation programs are developing candidates to meet and exceed educator standards.
Each and every student deserves to learn from a well-prepared educator. When educators are competent and confident in their knowledge, skills, and abilities, educators are better positioned to facilitate learning with students and support students socially, emotionally, and academically.
Goal 3: Educators are prepared with the knowledge, skills, dispositions, and cultural responsiveness to facilitate learning for all students.
Objectives
- Increase and improve culturally responsive and antiracist education for educators and preparation programs
- Strengthen educator preparation through program evaluation for continuous improvement
- Increase technical assistance to preparation programs, districts, and community partners to improve the performance of educators and programs
- Improve the educator assessment system with policies that advance equitable practices, center student success, and are responsive to educator needs
Key performance indicators
PESB recognizes the importance of analyzing assessment pass rates by race-ethnicity because of the legacy of harm caused by inappropriate research methods and the (mis)use of data to make claims about others. We anticipate having this information available in 2022.
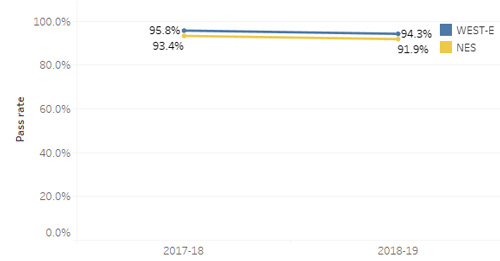
WEST-E / NES pass rate
The WEST-E or NES is a content knowledge assessment that teacher candidates must pass prior to becoming a certified teacher. Passing the WEST-E or NES is one way PESB knows if teacher candidates have been prepared with the knowledge necessary to serve K-12 students well. In 2018-19 data collection moved to the Education Research and Data Center (ERDC) In December 2020, PESB implemented a policy allowing for case by case exceptions (doc) to the content knowledge assessment requirement.
View this data in more detail.
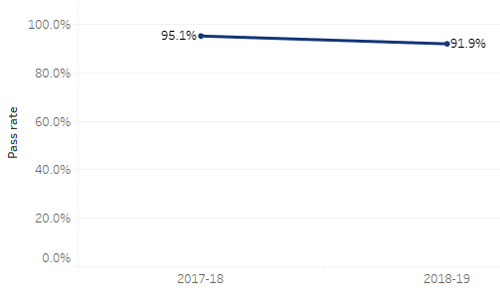
edTPA pass rate
The edTPA is a performance assessment that teacher candidates must pass prior to becoming a certified teacher. Passing the edTPA is one way PESB knows if teacher candidates have been prepared with the skills necessary to serve K-12 students well. In 2017 the edTPA passing score was increased. In 2018-19 data collection moved to the Education Research and Data Center (ERDC). In 2020 PESB began a multiple measures pilot allowing teacher candidates to demonstrate alternative evidence of effective performance.
View this data in more detail.
Cultural responsiveness
PESB is investigating measurements around cultural responsiveness.
Placement: Students are receiving instruction and services from properly credentialed educators.
The hiring and placement process of educators sets the stage for meaningful employment. The knowledge, skills, and dispositions for working with middle school students are very different from those of a kindergarten teacher, special education paraeducator, a high school principal, and a school psychologist. Districts must carefully consider an educator’s classroom assignment and ensure that students are at the center of those decisions. Once placed in those assigned roles, every educator, from novice to expert, needs onboarding support from colleagues and administrators to serve all students well.
Goal 4: All educators are appropriately credentialed for their assignment.
Objectives
- Increase statewide funding to support districts in providing required paraeducator training
- Increase district use of strategies to reduce out of endorsement placement
- Improve educator placement to support district workforce need
- Increase collaborative learning between districts and preparation programs to share promising practices for educator placement in shortage areas
Key performance indicators
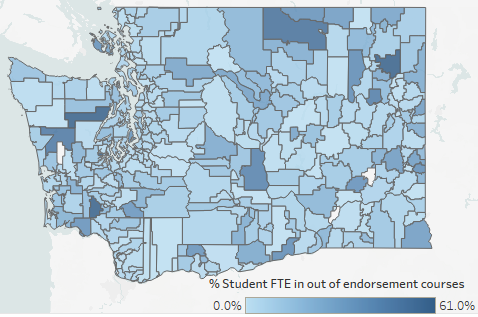
Time out-of-endorsement
K-12 courses are generally taught by teachers who often have an endorsement that PESB has matched to that course, but districts can choose to place a teacher in an out of endorsement assignment. In 2019-20, the amount of student time spent in class with out-of-endorsement teachers ranged from 0% to approximately 62.95%, depending on the district.
View this data in more detail.
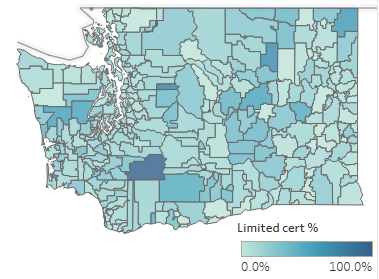
Limited certificate use
School districts may also use limited teacher certificates to assign teachers to K-12 courses. This can be an indicator of the need for credentialed teachers. In 2018-19, districts ranged from 0% teachers with a limited certificate to 95.8%.
Retention: Educators are engaged in a fulfilling and supportive work environment.
Most educators begin their careers feeling inspired, excited, and eager to enter the classroom. Despite this early motivation for positive student impact, many educators choose to leave the profession somewhere along their journey.
Although many factors can influence these decisions, we know through data and anecdotal evidence that educators are more likely to remain in the profession when they experience fulfilling work environments through quality professional learning, leadership opportunities, and culturally inclusive workplaces.
Goal 5: Educators continue in the profession.
Objectives
- Increase data tracking on factors that influence educator persistence and retention
- Increase and elevate retention strategies, such as HR practices and mentorships, that better support educators of color throughout the continuum of their career
- Explore and expand a system of ethics and conduct in which educators are treated with dignity and respect
Key performance indicators
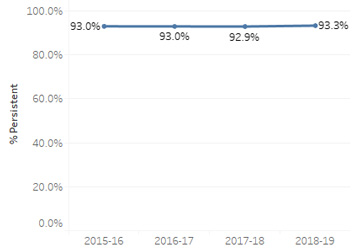
Teacher
Approximately 93% of all teachers in Washington K-12 continue the next year in some educator role. Beginning teachers consistently leave the profession at higher rates than the overall teacher workforce. In 2018-19, 86.2% of beginning teachers continued the next year in some educator role.
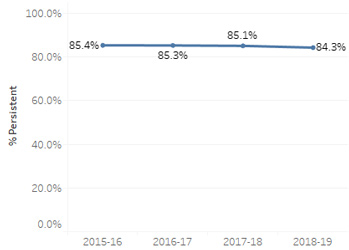
Paraeducator
Paraeducator persistence is noticeably lower than teachers’. In 2018-19, 84.3% of all paraeducators continued the next year in some educator role. That same year, 75.5% of beginning paraeducators continued the next year in some educator role.
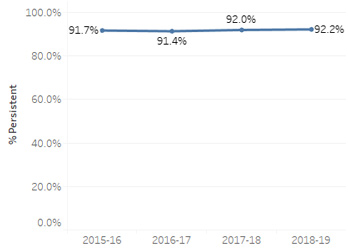
Educational staff associate (ESA)
The persistence of all ESAs is comparable to the teacher persistence rate. In 2018-19, 92.2% of all ESAs continued in some educator role the next year. Beginning nurses particularly are the least likely to persist. In 2018-19, 62.5% of beginning nurses continued as an educator the next year.
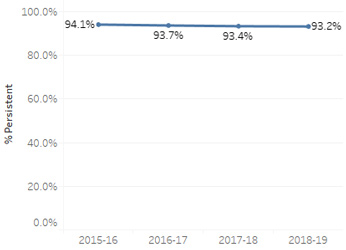
Vice/Principals, Administrators, and Deputy/Superintendents
Superintendents, deputy superintendents, principals, vice principals, and administrators have a comparable persistence rate to teachers as well: 93.2% of all in 2018-19 continued the next year in some educator role. However, they do appear more likely to change roles than teachers.
Growth and transition: Educators are advancing their career, and enhancing their professional skills
When educators enter the profession for the first time, they are a novice. Over time and through continuing education, reflection, professional development, and leadership opportunities, educators can transform their experience into expertise. As educator performance becomes more sophisticated, more refined, and more competent, more students and educators benefit. Moreover, when educators advance their careers, they uplift and advance the profession.
Goal 6: Educators have multiple opportunities for learning and growth that best support their career goals.
Objectives
- Increase equitable opportunities for educators to add credentials and access professional learning options
- Expand and improve areas of focused learning for all educator roles, particularly in culturally responsive and anti-racist practices
- Streamline the professional learning system to better track and recognize the growth and achievements of educators
Key performance indicators
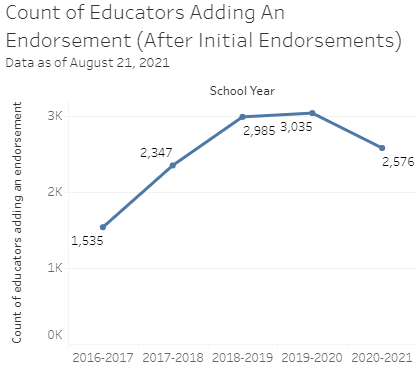
Adding an endorsement
In 2020-21, the most popular add-on endorsements were English Language Arts and Middle Level Mathematics.
View this data in more detail.
Professional development and persistence
- PESB is investigating the relationship between professional development and educator persistence.